mirror of
https://github.com/ivuorinen/docker-elk.git
synced 2026-01-26 03:34:01 +00:00
272 lines
12 KiB
Markdown
272 lines
12 KiB
Markdown
<p align="center">
|
|
<img width="500px" src="https://user-images.githubusercontent.com/16992394/147855783-07b747f3-d033-476f-9e06-96a4a88a54c6.png">
|
|
</p>
|
|
<h2 align="center"><b>Elast</b>ic Stack on <b>Docker</b></h2>
|
|
<h3 align="center">Preconfigured Security, Tools, and Self-Monitoring</h3>
|
|
<h4 align="center">Configured to be ready to be used for Log, Metrics, APM, Alerting, Machine Learning, and Security (SIEM) usecases.</h4>
|
|
<p align="center">
|
|
<a>
|
|
<img src="https://img.shields.io/badge/Elastic%20Stack-8.10.2-blue?style=flat&logo=elasticsearch" alt="Elastic Stack Version 7^^">
|
|
</a>
|
|
<a>
|
|
<img src="https://img.shields.io/github/v/tag/sherifabdlnaby/elastdocker?label=release&sort=semver">
|
|
</a>
|
|
<a href="https://github.com/sherifabdlnaby/elastdocker/actions/workflows/build.yml">
|
|
<img src="https://github.com/sherifabdlnaby/elastdocker/actions/workflows/build.yml/badge.svg">
|
|
</a>
|
|
<a>
|
|
<img src="https://img.shields.io/badge/Log4Shell-mitigated-brightgreen?style=flat&logo=java">
|
|
</a>
|
|
<a>
|
|
<img src="https://img.shields.io/badge/contributions-welcome-brightgreen.svg?style=flat" alt="contributions welcome">
|
|
</a>
|
|
<a href="https://github.com/sherifabdlnaby/elastdocker/network">
|
|
<img src="https://img.shields.io/github/forks/sherifabdlnaby/elastdocker.svg" alt="GitHub forks">
|
|
</a>
|
|
<a href="https://github.com/sherifabdlnaby/elastdocker/issues">
|
|
<img src="https://img.shields.io/github/issues/sherifabdlnaby/elastdocker.svg" alt="GitHub issues">
|
|
</a>
|
|
<a href="https://raw.githubusercontent.com/sherifabdlnaby/elastdocker/blob/master/LICENSE">
|
|
<img src="https://img.shields.io/badge/license-MIT-blue.svg" alt="GitHub license">
|
|
</a>
|
|
</p>
|
|
|
|
# Introduction
|
|
Elastic Stack (**ELK**) Docker Composition, preconfigured with **Security**, **Monitoring**, and **Tools**; Up with a Single Command.
|
|
|
|
Suitable for Demoing, MVPs and small production deployments.
|
|
|
|
Stack Version: [8.10.2](https://www.elastic.co/blog/whats-new-elastic-8-10-0) 🎉 - Based on [Official Elastic Docker Images](https://www.docker.elastic.co/)
|
|
> You can change Elastic Stack version by setting `ELK_VERSION` in `.env` file and rebuild your images. Any version >= 8.0.0 is compatible with this template.
|
|
|
|
### Main Features 📜
|
|
|
|
- Configured as a Production Single Node Cluster. (With a multi-node cluster option for experimenting).
|
|
- Security Enabled By Default.
|
|
- Configured to Enable:
|
|
- Logging & Metrics Ingestion
|
|
- Option to collect logs of all Docker Containers running on the host. via `make collect-docker-logs`.
|
|
- APM
|
|
- Alerting
|
|
- Machine Learning
|
|
- Anomaly Detection
|
|
- SIEM (Security information and event management).
|
|
- Enabling Trial License
|
|
- Use Docker-Compose and `.env` to configure your entire stack parameters.
|
|
- Persist Elasticsearch's Keystore and SSL Certifications.
|
|
- Self-Monitoring Metrics Enabled.
|
|
- Prometheus Exporters for Stack Metrics.
|
|
- Embedded Container Healthchecks for Stack Images.
|
|
|
|
#### More points
|
|
And comparing Elastdocker and the popular [deviantony/docker-elk](https://github.com/deviantony/docker-elk)
|
|
|
|
<details><summary>Expand...</summary>
|
|
<p>
|
|
|
|
One of the most popular ELK on Docker repositories is the awesome [deviantony/docker-elk](https://github.com/deviantony/docker-elk).
|
|
Elastdocker differs from `deviantony/docker-elk` in the following points.
|
|
|
|
- Security enabled by default using Basic license, not Trial.
|
|
|
|
- Persisting data by default in a volume.
|
|
|
|
- Run in Production Mode (by enabling SSL on Transport Layer, and add initial master node settings).
|
|
|
|
- Persisting Generated Keystore, and create an extendable script that makes it easier to recreate it every-time the container is created.
|
|
|
|
- Parameterize credentials in .env instead of hardcoding `elastich:changeme` in every component config.
|
|
|
|
- Parameterize all other Config like Heap Size.
|
|
|
|
- Add recommended environment configurations as Ulimits and Swap disable to the docker-compose.
|
|
|
|
- Make it ready to be extended into a multinode cluster.
|
|
|
|
- Configuring the Self-Monitoring and the Filebeat agent that ship ELK logs to ELK itself. (as a step to shipping it to a monitoring cluster in the future).
|
|
|
|
- Configured Prometheus Exporters.
|
|
|
|
- The Makefile that simplifies everything into some simple commands.
|
|
|
|
</p>
|
|
</details>
|
|
|
|
-----
|
|
|
|
# Requirements
|
|
|
|
- [Docker 20.05 or higher](https://docs.docker.com/install/)
|
|
- [Docker-Compose 1.29 or higher](https://docs.docker.com/compose/install/)
|
|
- 4GB RAM (For Windows and MacOS make sure Docker's VM has more than 4GB+ memory.)
|
|
|
|
# Setup
|
|
|
|
1. Clone the Repository
|
|
```bash
|
|
git clone https://github.com/sherifabdlnaby/elastdocker.git
|
|
```
|
|
2. Initialize Elasticsearch Keystore and TLS Self-Signed Certificates
|
|
```bash
|
|
$ make setup
|
|
```
|
|
> **For Linux's docker hosts only**. By default virtual memory [is not enough](https://www.elastic.co/guide/en/elasticsearch/reference/current/vm-max-map-count.html) so run the next command as root `sysctl -w vm.max_map_count=262144`
|
|
3. Start Elastic Stack
|
|
```bash
|
|
$ make elk <OR> $ docker-compose up -d <OR> $ docker compose up -d
|
|
```
|
|
4. Visit Kibana at [https://localhost:5601](https://localhost:5601) or `https://<your_public_ip>:5601`
|
|
|
|
Default Username: `elastic`, Password: `changeme`
|
|
|
|
> - Notice that Kibana is configured to use HTTPS, so you'll need to write `https://` before `localhost:5601` in the browser.
|
|
> - Modify `.env` file for your needs, most importantly `ELASTIC_PASSWORD` that setup your superuser `elastic`'s password, `ELASTICSEARCH_HEAP` & `LOGSTASH_HEAP` for Elasticsearch & Logstash Heap Size.
|
|
|
|
> Whatever your Host (e.g AWS EC2, Azure, DigitalOcean, or on-premise server), once you expose your host to the network, ELK component will be accessible on their respective ports. Since the enabled TLS uses a self-signed certificate, it is recommended to SSL-Terminate public traffic using your signed certificates.
|
|
|
|
> 🏃🏻♂️ To start ingesting logs, you can start by running `make collect-docker-logs` which will collect your host's container logs.
|
|
|
|
## Additional Commands
|
|
|
|
<details><summary>Expand</summary>
|
|
<p>
|
|
|
|
#### To Start Monitoring and Prometheus Exporters
|
|
```shell
|
|
$ make monitoring
|
|
```
|
|
#### To Ship Docker Container Logs to ELK
|
|
```shell
|
|
$ make collect-docker-logs
|
|
```
|
|
#### To Start **Elastic Stack, Tools and Monitoring**
|
|
```
|
|
$ make all
|
|
```
|
|
#### To Start 2 Extra Elasticsearch nodes (recommended for experimenting only)
|
|
```shell
|
|
$ make nodes
|
|
```
|
|
#### To Rebuild Images
|
|
```shell
|
|
$ make build
|
|
```
|
|
#### Bring down the stack.
|
|
```shell
|
|
$ make down
|
|
```
|
|
|
|
#### Reset everything, Remove all containers, and delete **DATA**!
|
|
```shell
|
|
$ make prune
|
|
```
|
|
|
|
</p>
|
|
</details>
|
|
|
|
# Configuration
|
|
|
|
* Some Configuration are parameterized in the `.env` file.
|
|
* `ELASTIC_PASSWORD`, user `elastic`'s password (default: `changeme` _pls_).
|
|
* `ELK_VERSION` Elastic Stack Version (default: `8.10.2`)
|
|
* `ELASTICSEARCH_HEAP`, how much Elasticsearch allocate from memory (default: 1GB -good for development only-)
|
|
* `LOGSTASH_HEAP`, how much Logstash allocate from memory.
|
|
* Other configurations which their such as cluster name, and node name, etc.
|
|
* Elasticsearch Configuration in `elasticsearch.yml` at `./elasticsearch/config`.
|
|
* Logstash Configuration in `logstash.yml` at `./logstash/config/logstash.yml`.
|
|
* Logstash Pipeline in `main.conf` at `./logstash/pipeline/main.conf`.
|
|
* Kibana Configuration in `kibana.yml` at `./kibana/config`.
|
|
|
|
### Setting Up Keystore
|
|
|
|
You can extend the Keystore generation script by adding keys to `./setup/keystore.sh` script. (e.g Add S3 Snapshot Repository Credentials)
|
|
|
|
To Re-generate Keystore:
|
|
```
|
|
make keystore
|
|
```
|
|
|
|
### Notes
|
|
|
|
|
|
- ⚠️ Elasticsearch HTTP layer is using SSL, thus mean you need to configure your elasticsearch clients with the `CA` in `secrets/certs/ca/ca.crt`, or configure client to ignore SSL Certificate Verification (e.g `--insecure` in `curl`).
|
|
|
|
- Adding Two Extra Nodes to the cluster will make the cluster depending on them and won't start without them again.
|
|
|
|
- Makefile is a wrapper around `Docker-Compose` commands, use `make help` to know every command.
|
|
|
|
- Elasticsearch will save its data to a volume named `elasticsearch-data`
|
|
|
|
- Elasticsearch Keystore (that contains passwords and credentials) and SSL Certificate are generated in the `./secrets` directory by the setup command.
|
|
|
|
- Make sure to run `make setup` if you changed `ELASTIC_PASSWORD` and to restart the stack afterwards.
|
|
|
|
- For Linux Users it's recommended to set the following configuration (run as `root`)
|
|
```
|
|
sysctl -w vm.max_map_count=262144
|
|
```
|
|
By default, Virtual Memory [is not enough](https://www.elastic.co/guide/en/elasticsearch/reference/current/vm-max-map-count.html).
|
|
|
|
---------------------------
|
|
|
|

|
|

|
|

|
|

|
|
|
|
# Working with Elastic APM
|
|
|
|
After completing the setup step, you will notice a container named apm-server which gives you deeper visibility into your applications and can help you to identify and resolve root cause issues with correlated traces, logs, and metrics.
|
|
|
|
## Authenticating with Elastic APM
|
|
|
|
In order to authenticate with Elastic APM, you will need the following:
|
|
|
|
- The value of `ELASTIC_APM_SECRET_TOKEN` defined in `.env` file as we have [secret token](https://www.elastic.co/guide/en/apm/guide/master/secret-token.html) enabled by default
|
|
- The ability to reach port `8200`
|
|
- Install elastic apm client in your application e.g. for NodeJS based applications you need to install [elastic-apm-node](https://www.elastic.co/guide/en/apm/agent/nodejs/master/typescript.html)
|
|
- Import the package in your application and call the start function, In case of NodeJS based application you can do the following:
|
|
|
|
```
|
|
const apm = require('elastic-apm-node').start({
|
|
serviceName: 'foobar',
|
|
secretToken: process.env.ELASTIC_APM_SECRET_TOKEN,
|
|
|
|
// https is enabled by default as per elastdocker configuration
|
|
serverUrl: 'https://localhost:8200',
|
|
})
|
|
```
|
|
> Make sure that the agent is started before you require any other modules in your Node.js application - i.e. before express, http, etc. as mentioned in [Elastic APM Agent - NodeJS initialization](https://www.elastic.co/guide/en/apm/agent/nodejs/master/express.html#express-initialization)
|
|
|
|
For more details or other languages you can check the following:
|
|
- [APM Agents in different languages](https://www.elastic.co/guide/en/apm/agent/index.html)
|
|
|
|
# Monitoring The Cluster
|
|
|
|
### Via Self-Monitoring
|
|
|
|
Head to Stack Monitoring tab in Kibana to see cluster metrics for all stack components.
|
|
|
|

|
|

|
|
|
|
> In Production, cluster metrics should be shipped to another dedicated monitoring cluster.
|
|
|
|
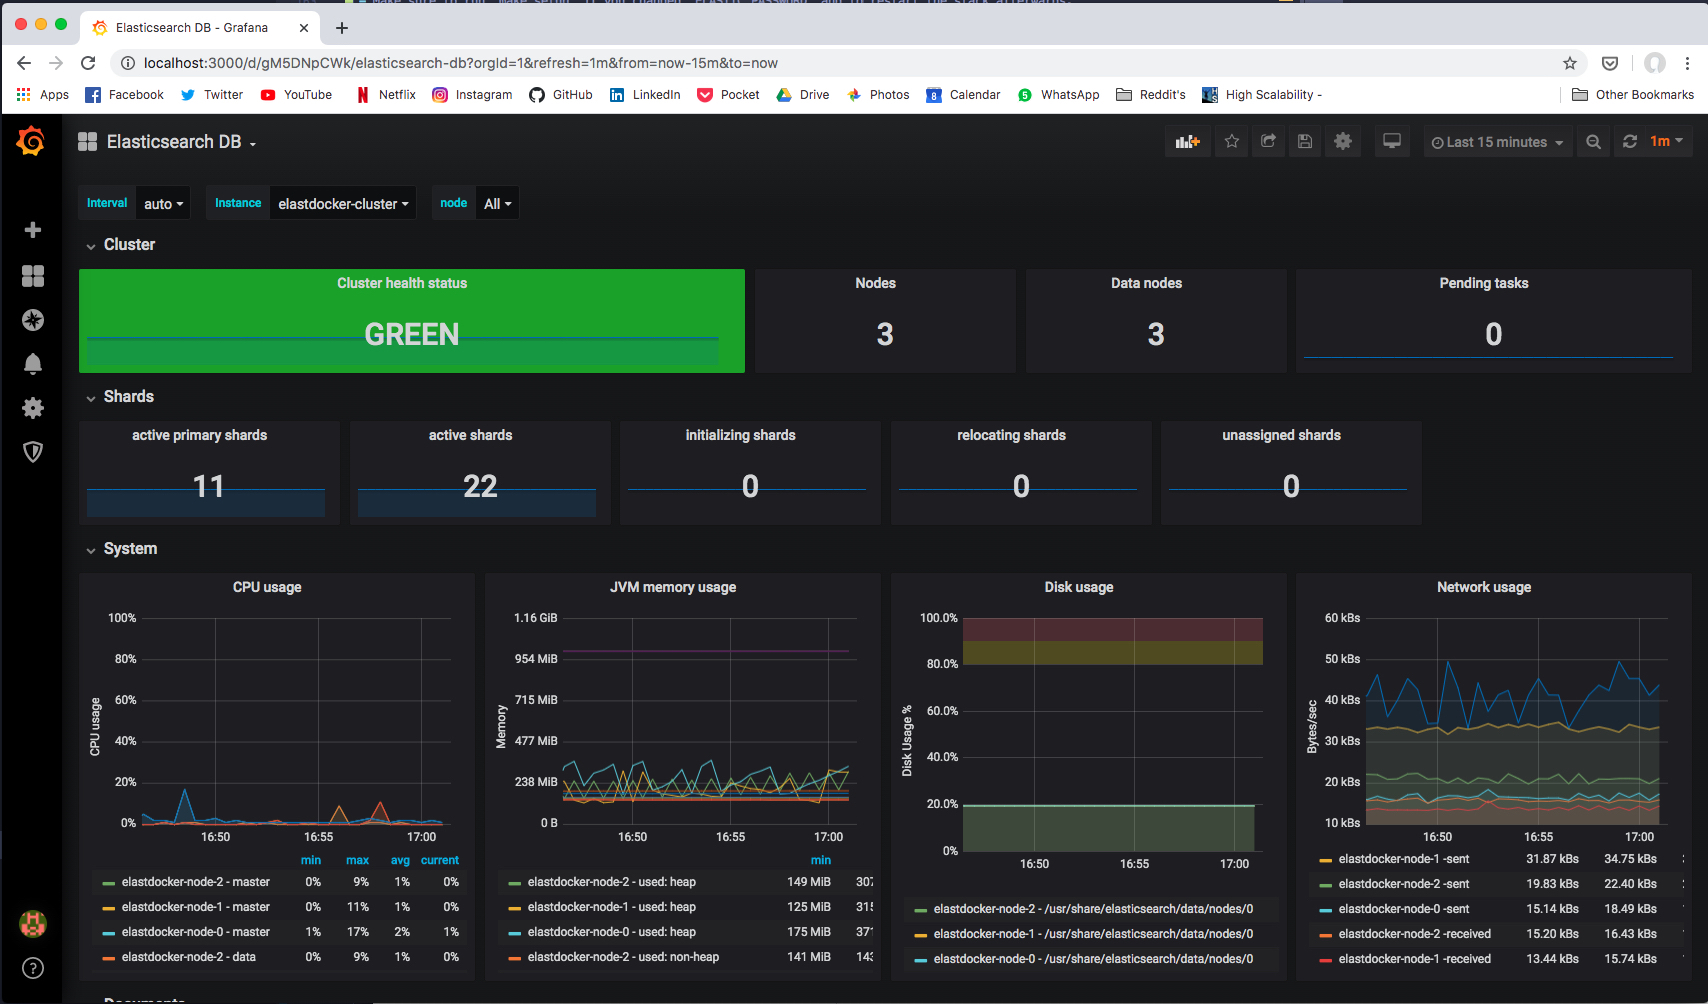
### Via Prometheus Exporters
|
|
If you started Prometheus Exporters using `make monitoring` command. Prometheus Exporters will expose metrics at the following ports.
|
|
|
|
| **Prometheus Exporter** | **Port** | **Recommended Grafana Dashboard** |
|
|
|-------------------------- |---------- |------------------------------------------------ |
|
|
| `elasticsearch-exporter` | `9114` | [Elasticsearch by Kristian Jensen](https://grafana.com/grafana/dashboards/4358) |
|
|
| `logstash-exporter` | `9304` | [logstash-monitoring by dpavlos](https://github.com/dpavlos/logstash-monitoring) |
|
|
|
|
|
|
|
|
# License
|
|
[MIT License](https://raw.githubusercontent.com/sherifabdlnaby/elastdocker/master/LICENSE)
|
|
Copyright (c) 2022 Sherif Abdel-Naby
|
|
|
|
# Contribution
|
|
|
|
PR(s) are Open and Welcomed.
|